Dental Tribune South Asia had published on 10th March 2020 - a report on Farr's law, which states that "epidemics tend to rise and fall in a roughly symmetrical pattern or bell-shaped curve." AIDS, SARS, Ebola — they all followed that pattern. That report was based on a study jointly published by Shanghai and Rutgers universities. With more and more data coming in, there are two more reports - one using simple statistical methods and the other using the SIR Model for Spread of Disease, The Differential Equation Model.
1. Data highlighting Farr's law by Shanghai University, China and Rutger's Public Health School, NJ, USA:
Dental Tribune South Asia had published on 10th March 2020 - a report on Farr's law, which states that "epidemics tend to rise and fall in a roughly symmetrical pattern or bell-shaped curve." AIDS, SARS, Ebola — they all followed that pattern. So does seasonal flu each year.
Farr's law - an often ignored law in every epidemic hysteria - may throw some light on the pattern of epidemics including that of coronavirus (COVID-19) that is turning into a pandemic. A group of researchers from Shanghai Jiao Tong University School of Medicine, China and Rutgers School of Public Health, NJ, USA have developed a model based on Farr's law using the data available on Feb. 8, 2020. They have analysed the data to predict the daily-incidence of 2019-nCoV infection in China, Hubei Province and Wuhan City afterwards. Will this model be accurate in predicting the rise and fall of Coronavirus (COVID-19)?
Isaac Ben Israel's statistical analysis of the spread of COVID-19 shows a pattern and resembles a curve
A prominent Israeli mathematician, analyst and former general Isaac Ben Israel claims that simple statistical analysis demonstrates that the spread of COVID-19 follows a pattern and resembles a curve. Prof Isaac Ben-Israel, head of the Security Studies program in Tel Aviv University and the chairman of the National Council for Research and Development, has explained the research he conducted with a fellow professor, analyzing the growth and decline of new cases in countries around the world, showed repeatedly that “there’s a set pattern” and “the numbers speak for themselves.”
He says the numbers peak after about 40 days and decline to almost zero after 70 days — no matter where it strikes, and no matter what measures governments impose to try to thwart it.
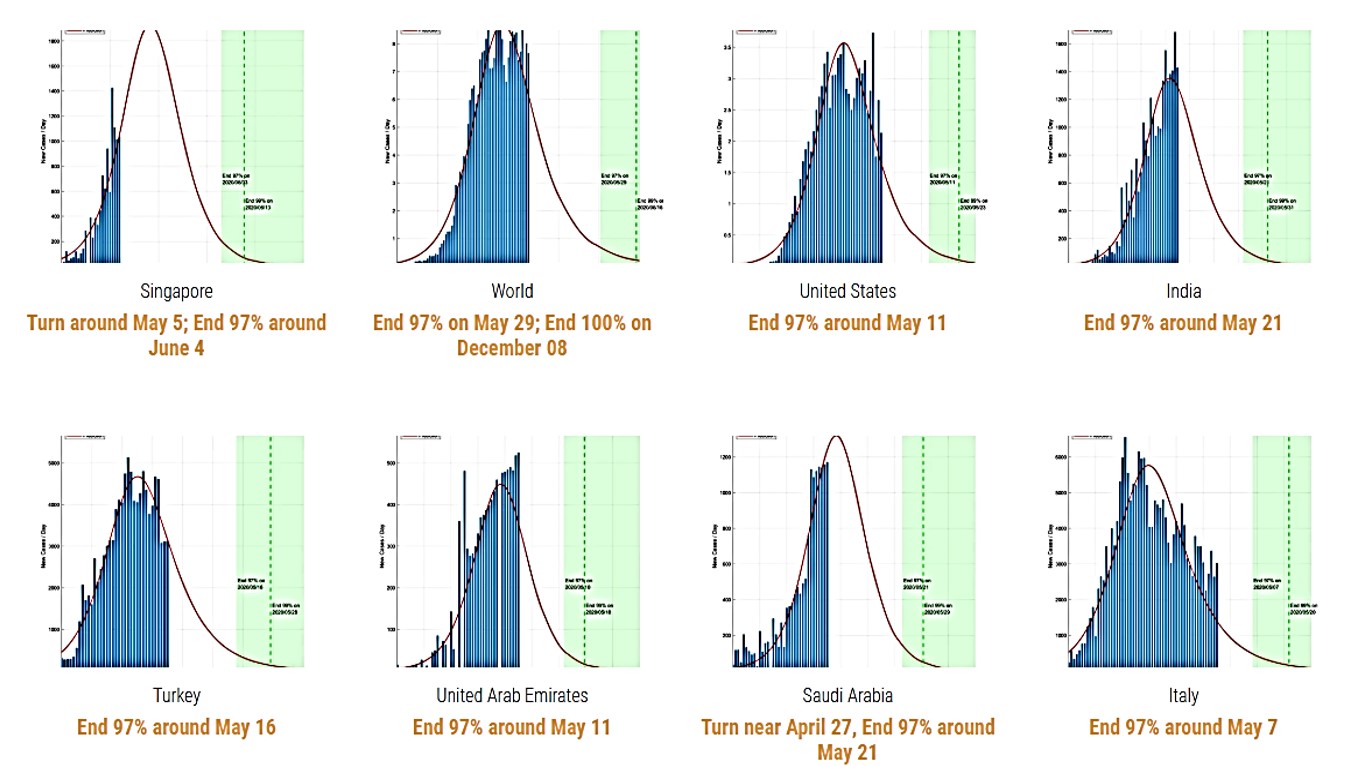
3. Data analysis based on the SIR (susceptible-infected-recovered) epidemic model by the Singapore University of Technology and Design (SUTD)
The researchers at SUTD have used the "SIR (susceptible-infected-recovered) epidemic model" using the data from different countries to predict the key dates of transition during the coronavirus lifecycle across the globe.
When Will COVID-19 End Data-Driven Estimation of End Dates (as of April 25, 2020, daily updated) by Singapore University of Technology and Design (SUTD), Data-Driven Innovation Lab
The SUTD has predicted through mathematical modelling that COVID-19 will end 97% in India around May 21. The model uses data from Our World in Data and applies the SIR Model for Spread of Disease, The Differential Equation Model. According to SUTD, the prediction is updated daily with the latest data and the analysis and predictions are only for educational and research purposes. They have also put a disclaimer that the report may contain errors. The model and data are inaccurate to the complex, evolving, and heterogeneous realities of different countries. Predictions are uncertain by nature. Readers must take any predictions with caution. Overly optimism based on some predicted end dates is dangerous because it may loosen our disciplines and controls and cause the turnaround of the virus and infection, and must be avoided.
Dr Elham Kateeb’s professional career has been devoted to dentistry: She is an associate professor of dental public health and the dean of scientific ...
Dr Ashwini Bhangale (BDS) summarizes the latest updates on the use of masks - from the World Health Organization (WHO), released on 1 Dec 2020 and the ...
This editorial describes all the major studies done from 1985 until 2020 and describes the mechanisms by which the body may reduce the effectiveness of a ...
LEIPZIG, Germany: Since the COVID-19 pandemic has severely restricted access to clinical practice, students around the world have been adversely affected by...
Mind your mind because a dilapidated one is worse than having none. Dr. Bhavdeep Singh Ahuja emphasizes the importance of mental health in these challenging...
MILAN, Italy: Since the evidence of oral manifestations linked to SARS-CoV-2 is scarce, researchers have recently set out to fill the gap by investigating ...
BLOOMFIELD, Conn., U.S: A new study published by Cigna, a worldwide health services organization, helps confirm the connection between oral health and ...
LONDON, UK/CHENNAI, India: UK Research and Innovation and India’s Department of Biotechnology in the Ministry of Science and Technology have recently ...
A cross-sectional study conducted among the dental professionals across India has shown that COVID-19 has disrupted the source of income for the majority of...
Education
Live webinar Fri. 31 July 2026 9:30 pm IST (New Delhi)
Tooth decay remains the most widespread chronic health condition globally, affecting billions of people. While cavities are largely preventable and ...
MUMBAI, India: Can clinicians identify patients at higher risk of implant complications before surgery? Can understanding the patient’s immune response ...
Implant dentistry has evolved significantly through advances in implant design, surface technology and digital workflows. However, the process of osteotomy ...

 International / International
 Brazil / Brasil
 Canada / Canada
 Latin America / Latinoamérica
 USA / USA
 Austria / Österreich
 Bosnia and Herzegovina / Босна и Херцеговина
 Bulgaria / България
 Croatia / Hrvatska
 Czech Republic & Slovakia / Česká republika & Slovensko
 France / France
 Germany / Deutschland
 Greece / ΕΛΛΑΔΑ
 Hungary / Hungary
 Italy / Italia
 Netherlands / Nederland
 Nordic / Nordic
 Poland / Polska
 Portugal / Portugal
 Romania & Moldova / România & Moldova
 Slovenia / Slovenija
 Serbia & Montenegro / Србија и Црна Гора
 Spain / España
 Switzerland / Schweiz
 Turkey / Türkiye
 UK & Ireland / UK & Ireland
 China / 中国
 Pakistan / Pākistān
 Vietnam / Việt Nam
 ASEAN / ASEAN
 Israel / מְדִינַת יִשְׂרָאֵל
 Algeria, Morocco & Tunisia / الجزائر والمغرب وتونس
 Middle East / Middle East

 Dr. Sergio FlorencioLive webinar
 Dr. Cameron Shahbazian DMD MBARegister now1CELive webinar
 Dr. Bruce McFarlane Certified Specialist in Orthodontics Fellow: Royal College of Dentists of Canada Diplomate: American Board of OrthodonticsLive webinar

 Prof. Dr. Wael Att, Dr. Andrea Laureti ITI Scholar Michigan, Dr. Acela Martinez


 updates from WHO and CDC on the use of masks in the context of COVID-19")
 pandemic.")


Dental surgeons should also be considered in this national level health crisis, in all the way. thank you sir